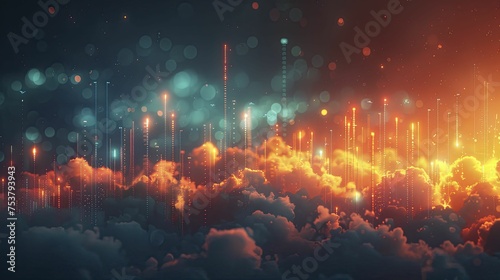
A chart depicting the rise in greenhouse gas concentrations is shown in a digital graphic over time.
Palabras clave
digital,
graphic,
chart,
increase,
atmospheric,
greenhouse,
gas,
time,
datum,
visualisation,
trend,
environmental,
impact,
global,
warming,
climate,
change,
emission,
level,
earth,
science,
technology,
infographic,
diagram,
analysis,
growth,
pollutant,
diagrammatic,
representation,
statistic,
information,
display,
pattern,
research,
insight,
interpretation,
rising,
upward,
line,
progression,
evolution,
upturn,
surge,
spike,
incline
Elementos relacionados